Profiling in PyTorch: Why You Need to Master torch.profiler
Stop guessing why your models are slow. Here is how to actually read a profiler trace and figure out where your GPU is sleeping....
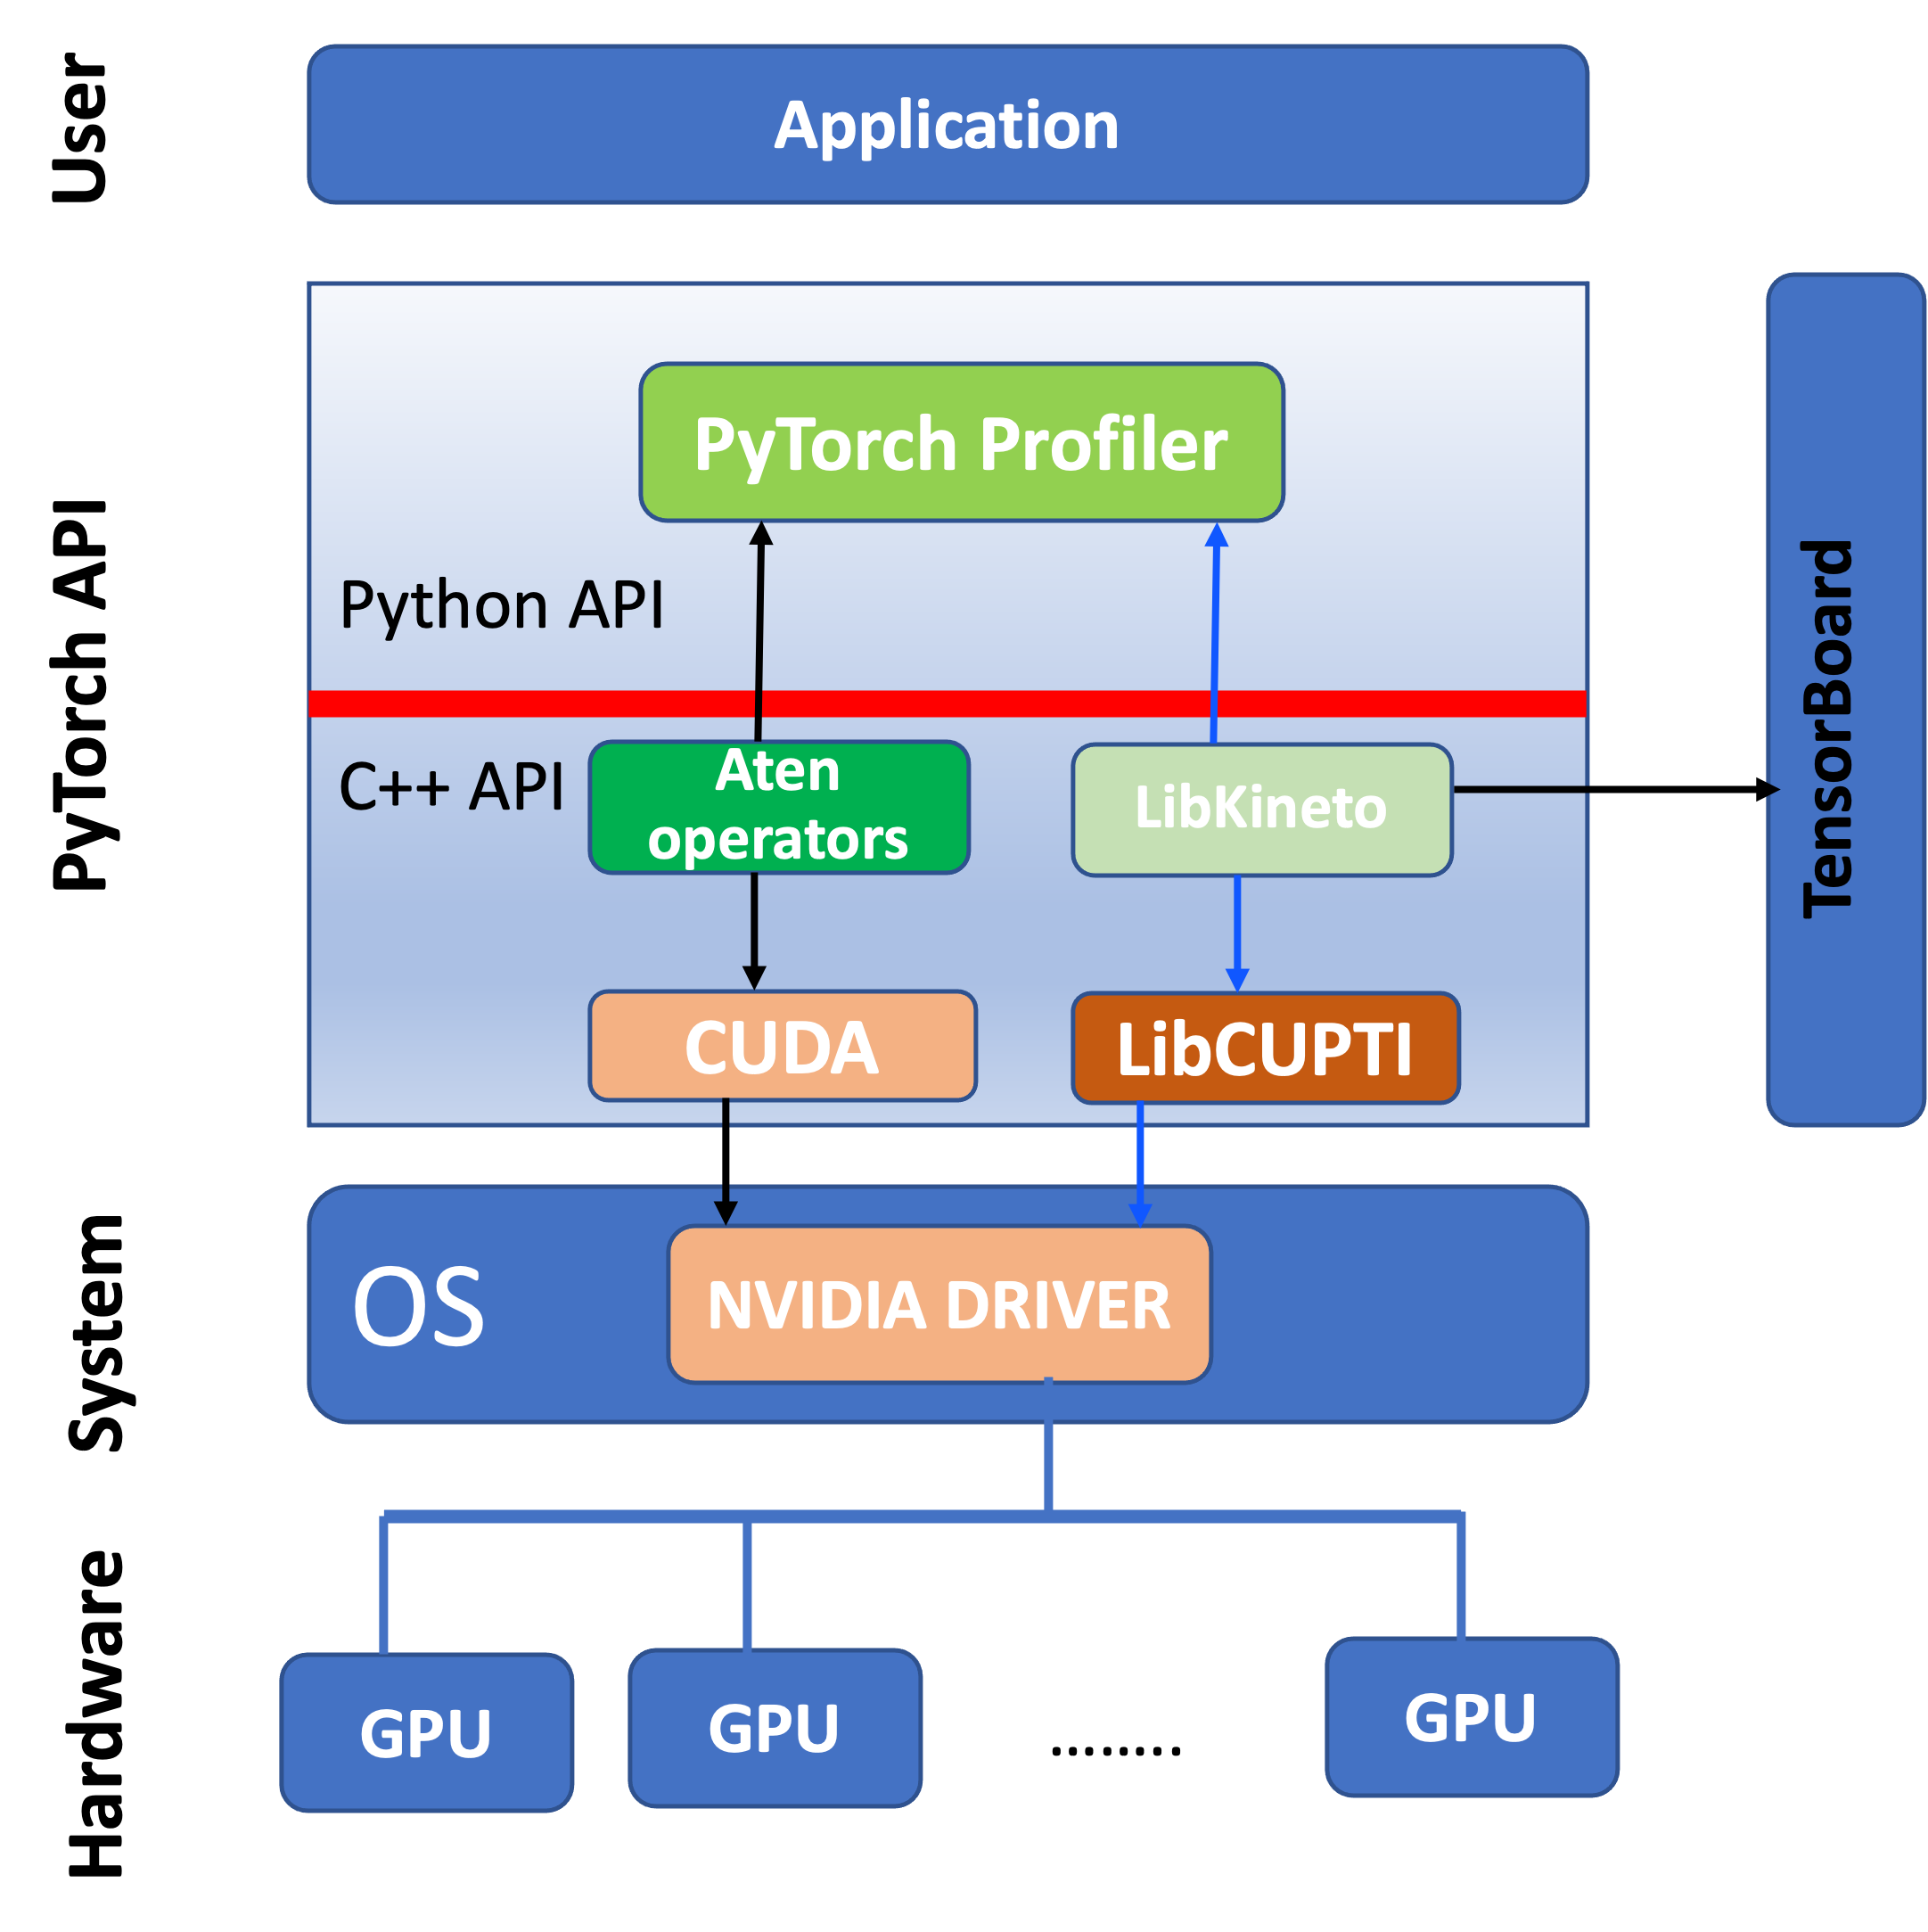
What you cannot profile, you cannot optimize. It is an old truth that feels painfully relevant every time a training loop chugs along at half the speed of the hardware spec sheet. Everyone wants to squeeze more tokens per second out of their large language models or shave precious milliseconds off inference latency, yet most developers treat performance tuning like voodoo. We scatter random timers around our code, cross our fingers, and hope the bottleneck reveals itself. It rarely does.
The real problem isn't that optimization is hard; it's that the tools look hostile. Open up a trace file for the first time, and you are greeted by dense walls of neon rectangles and terrifyingly granular event names that assume you already possess a PhD in CUDA scheduling. No wonder people put it off. Who wants to stare at an incomprehensible timeline when there are actual features to build? But if you want to move past guesswork, mastering torch.profiler is non-negotiable. You have to bridge the gap between Python and the metal.
Let's break down the fundamentals without the academic fluff. The deep neural networks are essentially glorified matrix multiplications wrapped in non-linearities. Meaning your CPU spends most of its time frantically dispatching commands to keep parallel threads on the GPU fed. When there's a hiccup, you get suspicious gaps in the timeline – those dead zones where expensive silicon sits entirely idle while the CPU scrambles to catch up.
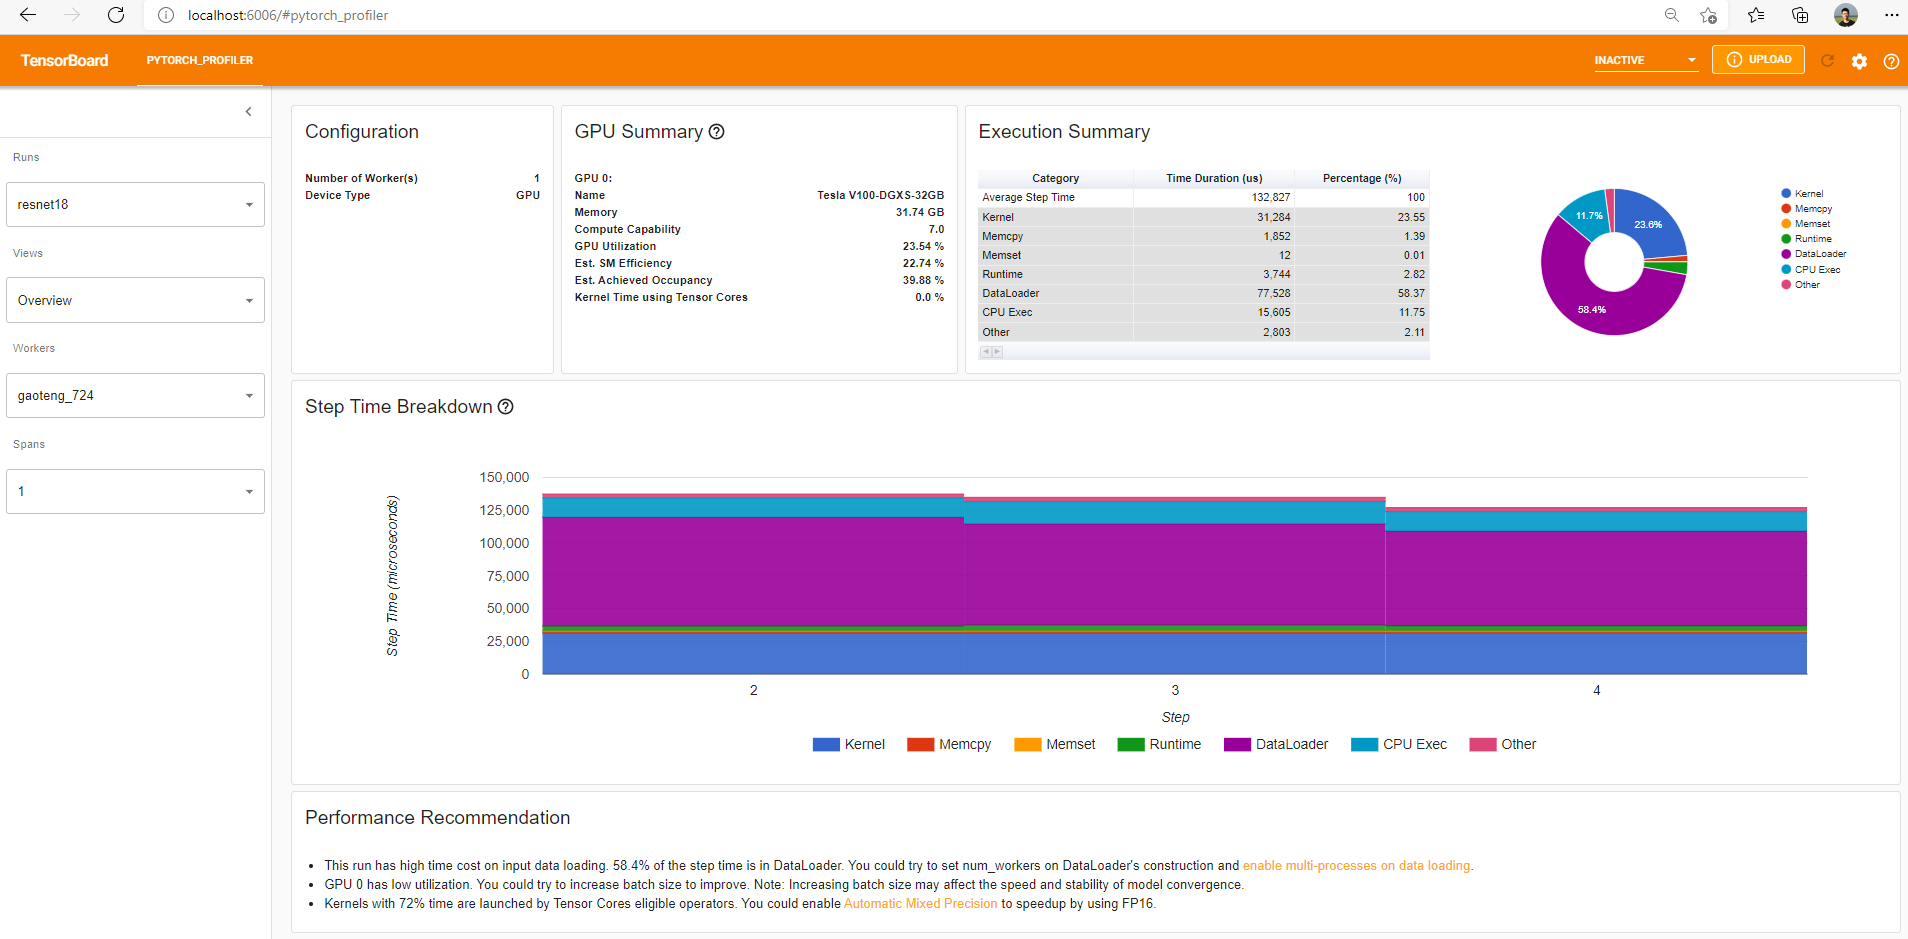
Getting comfortable with this workflow changes how you look at code entirely. You stop guessing why a matmul operation stalled or whether torch.compile actually did anything useful under the hood, because the timeline tells the unvarnished truth. It takes a little patience to decode the CPU and GPU lanes, but once the relationship between a high-level Python call and a low-level CUDA kernel clicks, performance tuning stops feeling like guesswork and starts feeling like engineering.