Profiling in PyTorch: Why Attention Is All You Profile
Most engineers treat attention as a black box, but looking under the hood with a PyTorch profiler reveals where your model actually bleeds performance....
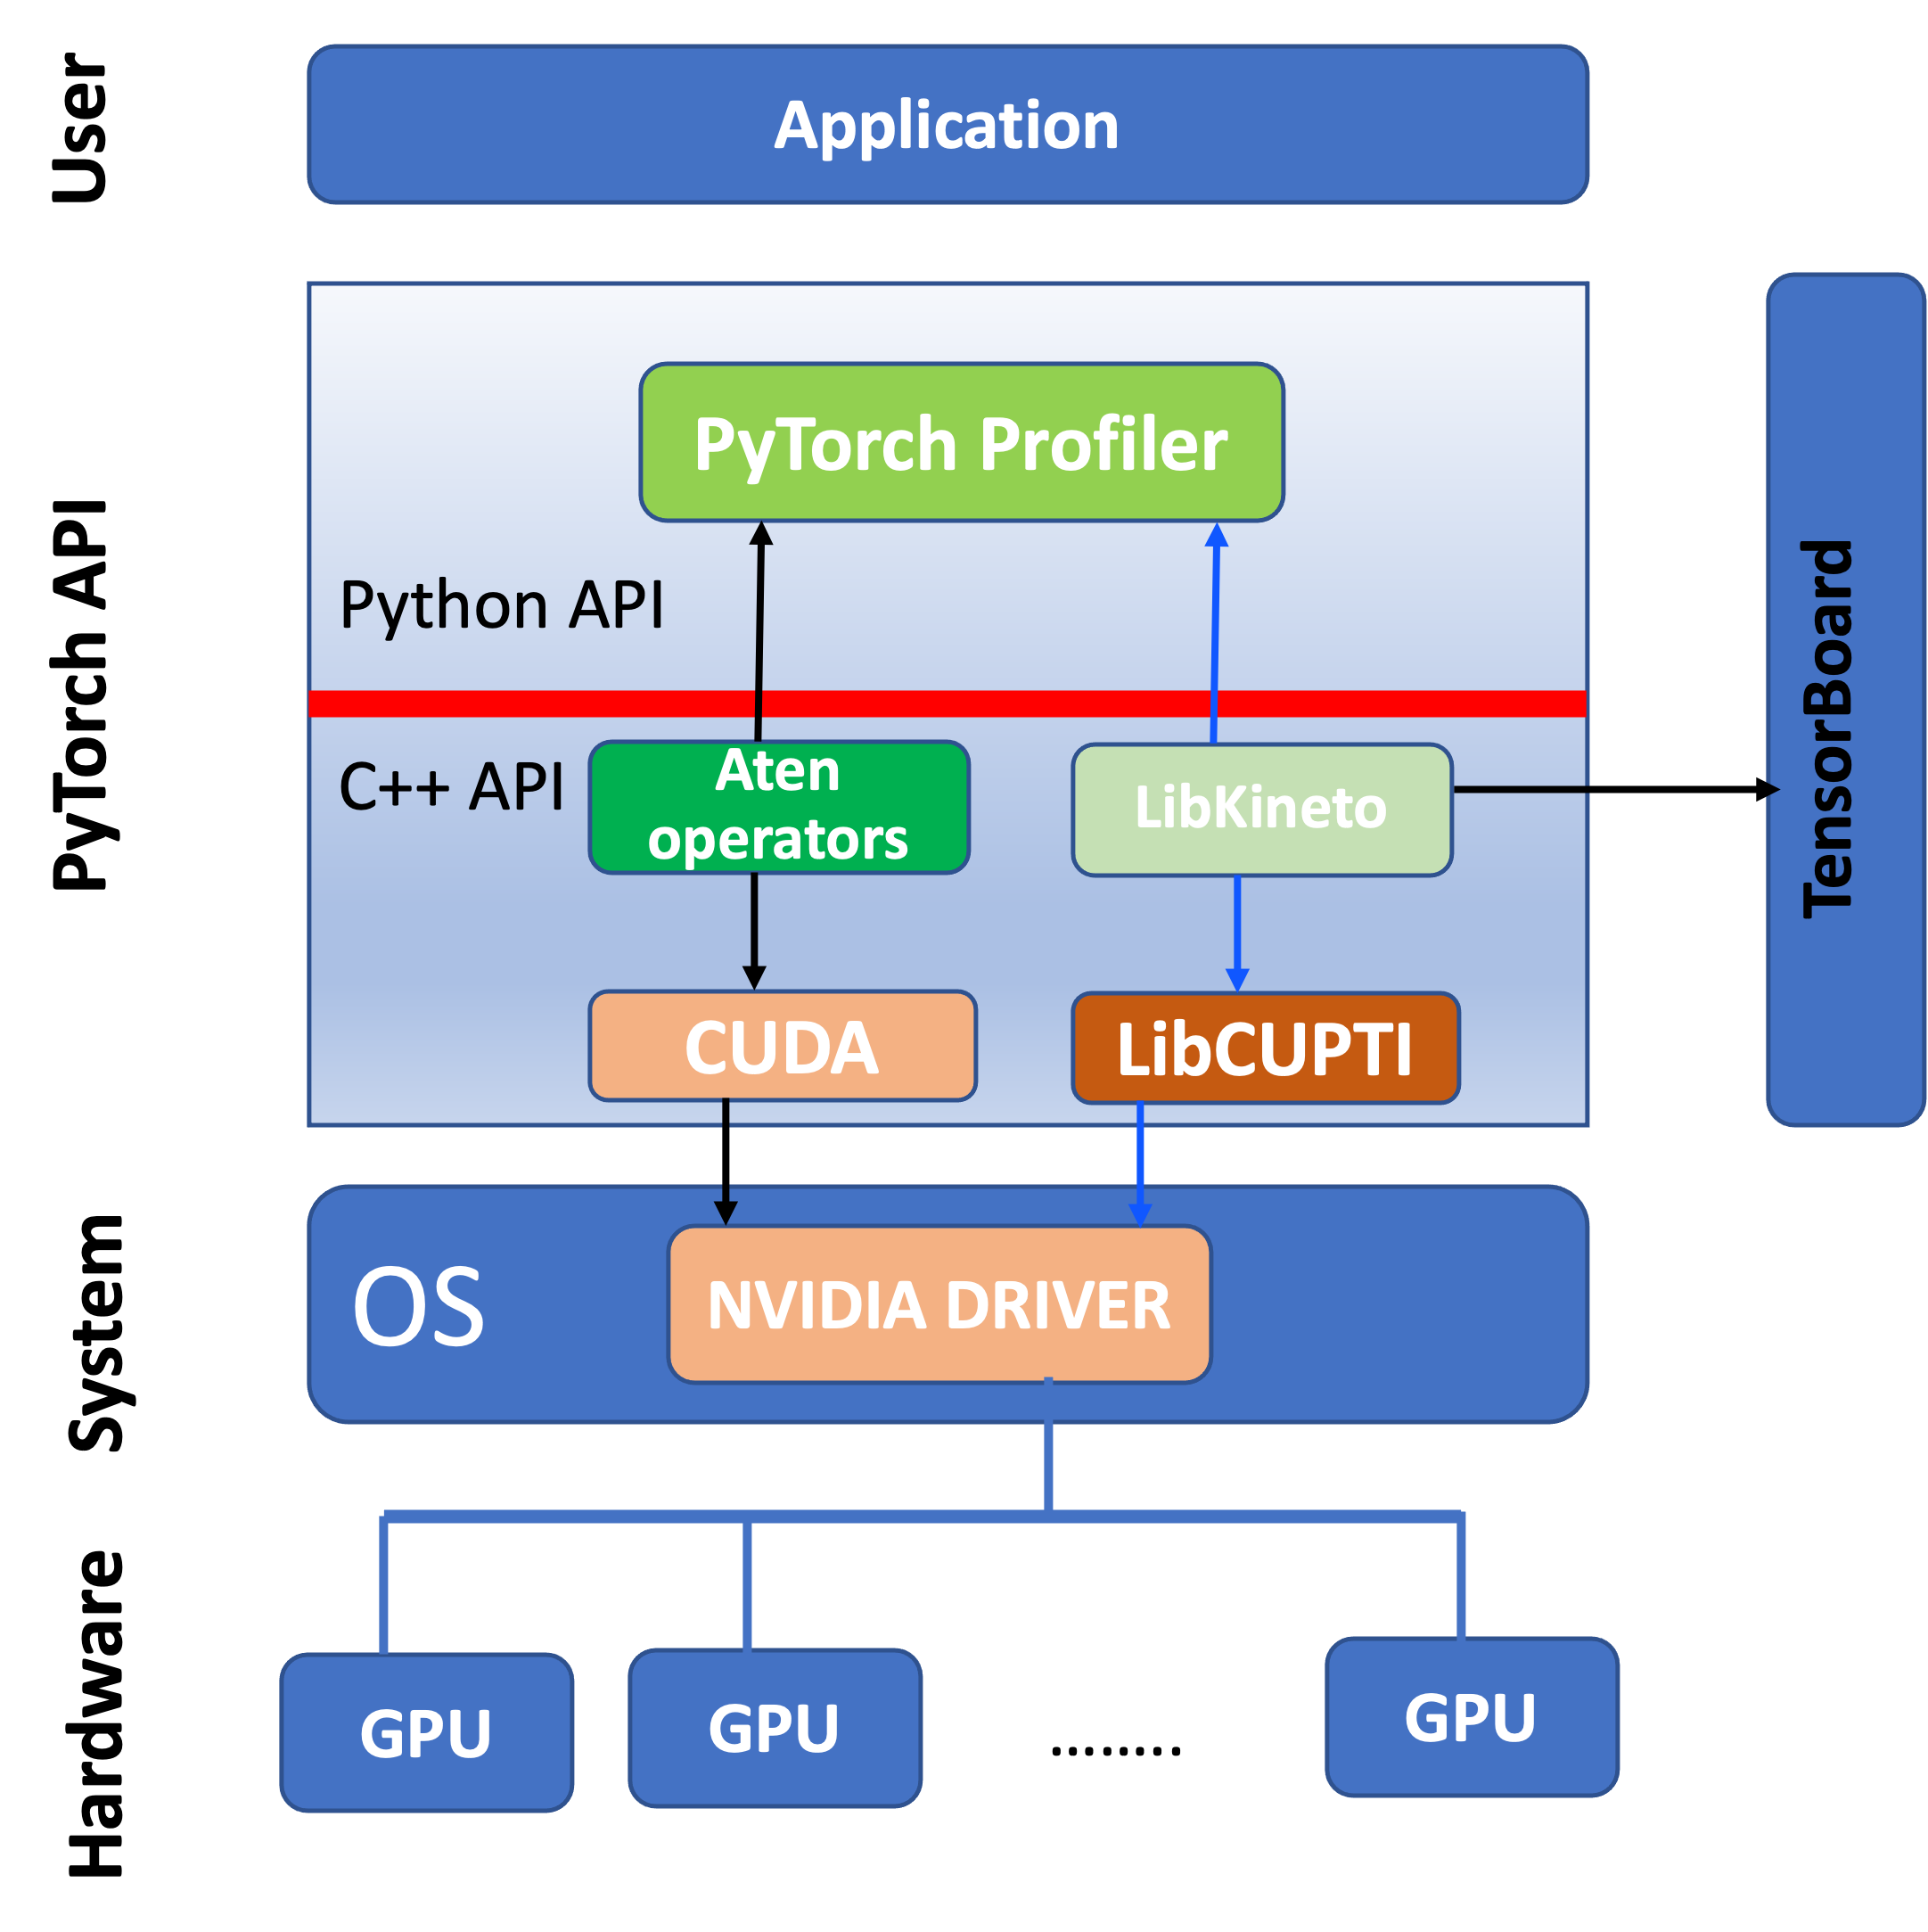
Most engineers treat attention as a black box. They import a transformer, watch the loss curve drop, and pray the hardware holds up when it hits production. That is a mistake. If you want to build systems that actually scream on real silicon, you have to stop guessing about bottlenecks and start profiling in PyTorch. It separates the folks who copy-paste documentation from the ones who understand how bytes actually move across high-bandwidth memory.
Look at how a naive attention block breaks down in code. You take your queries, multiply them by transposed keys, scale the output, slap on a causal mask, run a softmax, and finally reweight the values with a second matrix multiplication. Simple, right? Conceptually, yes. Under a profiler trace, however, that sequence turns into a chaotic mess of intermediate tensor allocations that thrash your GPU cache and destroy your throughput.
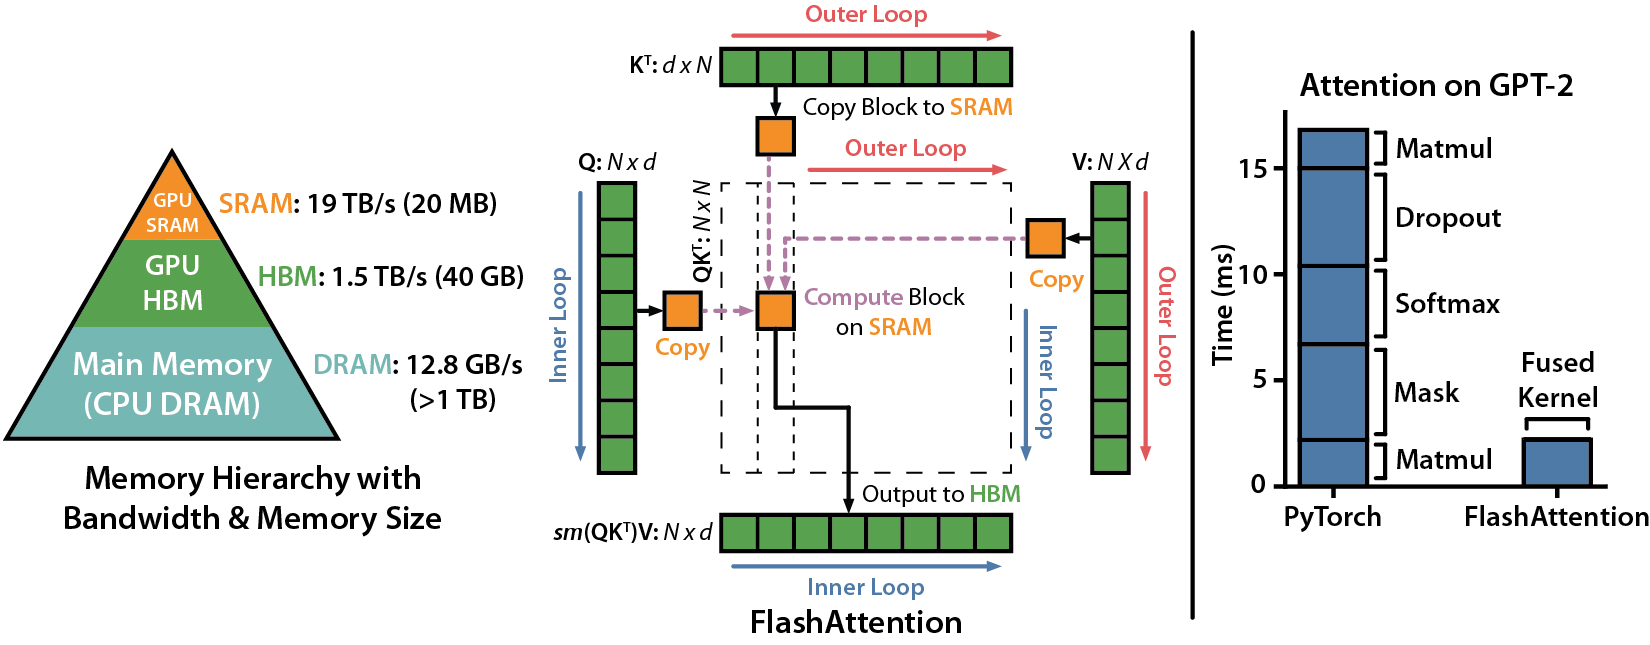
This is why the architecture of your operations matters way more than the high-level API calls you make. Every time you write a separate scaling step or a standalone mask filling operation, you force the hardware to write intermediate results back to global memory and read them right back out. It is slow. It is wasteful. And standard metrics will never tell you it is happening.
Smart tuning isn't about throwing an A100 at a lazy implementation. It is about reading the trace, finding the memory bottlenecks, and replacing disjointed primitive ops with fused kernels that keep intermediate data right where it belongs: in the registers.